5 From Sample to Population - Understanding Randomness, Sampling, and Inference
5.1 Sampling Methods
Probability Sampling
Probability sampling methods involve random selection, giving each member of the population a known, non-zero chance of being selected. These methods allow researchers to calculate sampling error and make statistical inferences about the population.
- Simple Random Sampling (SRS)
- Definition: Each member of the population has an equal chance of being selected.
- Advantages: Minimizes selection bias; allows straightforward statistical analysis.
- Disadvantages: Requires a complete sampling frame; may not capture enough members of smaller subgroups.
- Example: To select 100 students from a university with 10,000 students, assign each student a number and use a random number generator to select 100 numbers.
- Best used when: The population is relatively homogeneous and a complete list of population members is available.
- Stratified Random Sampling
- Definition: The population is divided into mutually exclusive subgroups (strata) based on shared characteristics, then samples are randomly selected from each stratum.
- Advantages: Ensures representation of key subgroups; can improve precision for same sample size as SRS; allows analysis within and between strata.
- Disadvantages: Requires prior knowledge of population characteristics for stratification; more complex analysis.
- Example: In a national political survey, divide the population into strata based on geographic regions (Northeast, Midwest, South, West) and then randomly sample from each region proportionally to their population size.
- Best used when: The population contains distinct subgroups that might respond differently to the research question.
- Cluster Sampling
- Definition: The population is divided into clusters (usually geographic), some clusters are randomly selected, and all members within those clusters are studied.
- Advantages: More cost-effective when population is geographically dispersed; doesn’t require a complete list of population members.
- Disadvantages: Lower statistical precision than SRS or stratified sampling; clusters must be representative.
- Example: To study high school students’ study habits, randomly select 20 high schools from across the country and survey all students in those schools.
- Best used when: The population is widely dispersed geographically and traveling to all units would be costly.
- Systematic Sampling
- Definition: Selecting every kth item from a list after a random start.
- Advantages: Simple to implement; often more practical than SRS; can avoid neighbor effects.
- Disadvantages: Can introduce bias if there’s a periodic pattern in the list.
- Example: At a busy shopping mall, survey every 20th person who enters, starting with a randomly chosen number between 1 and 20.
- Best used when: The population is ordered randomly or in a way unrelated to the study variables.
- Multi-stage Sampling
- Definition: Combining multiple sampling methods in stages.
- Advantages: Practical for large-scale surveys; balances cost and precision.
- Disadvantages: Complex design and analysis; multiple stages can compound sampling errors.
- Example: First randomly select counties (cluster sampling), then randomly select households within those counties (simple random sampling), and finally select one adult from each household (systematic sampling).
- Best used when: Studying large, complex populations across wide geographical areas.
Non-probability Sampling
Non-probability sampling doesn’t involve random selection, which means statistical inferences about the population must be made with caution. While it can introduce bias, it may be necessary in certain situations.
- Convenience Sampling
- Definition: Selecting easily accessible subjects.
- Advantages: Fast, inexpensive, and easy to implement.
- Disadvantages: High risk of selection bias; limits generalizability.
- Example: A researcher studying college students’ sleep patterns might survey students in their own classes.
- Best used for: Pilot studies, exploratory research, or when resources are severely limited.
- Purposive Sampling
- Definition: Selecting subjects based on specific characteristics relevant to the research question.
- Advantages: Focuses on relevant cases; useful for in-depth studies of specific groups.
- Disadvantages: Researcher bias in selection; limited generalizability.
- Example: For a study on the experiences of CEOs in the tech industry, intentionally seek out and interview CEOs from various tech companies.
- Best used for: Qualitative research, case studies, or studying unique populations.
- Snowball Sampling
- Definition: Participants recruit other participants from their networks.
- Advantages: Access to hard-to-reach or hidden populations; builds on social networks.
- Disadvantages: Sample biased toward those in certain social networks; cannot calculate selection probabilities.
- Example: In a study of undocumented immigrants’ access to healthcare, researchers ask initial participants to refer other potential participants.
- Best used for: Studying rare populations or sensitive topics where no sampling frame exists.
- Quota Sampling
- Definition: Selecting participants to meet specific quotas for certain characteristics to match known population parameters.
- Advantages: Ensures representation of key demographic groups; faster and cheaper than probability sampling; doesn’t require sampling frame.
- Disadvantages: Non-random selection within quotas can introduce bias; inference is limited.
- Example: In a market research study, researchers ensure they interview specific numbers of people from different age groups, genders, and income levels.
- Best used for: Commercial polling, market research, or when probability sampling is not feasible.
Why Pollsters Increasingly Use Quota Sampling
In recent years, many polling organizations have shifted toward quota sampling approaches for several key reasons:
Declining Response Rates: Traditional probability-based telephone polls have seen response rates drop from about 36% in the 1990s to less than 10% today. This increases costs and potentially introduces non-response bias that can be worse than selection bias from non-probability methods.
Coverage Issues: Random digit dialing no longer reaches a representative sample of the population as many people have abandoned landlines for cell phones, and many don’t answer calls from unknown numbers.
Cost Efficiency: Probability-based polls have become prohibitively expensive as response rates decline, while online panels and quota sampling are more affordable.
Speed: In fast-moving political campaigns or rapidly evolving public opinion situations, quota sampling can deliver results much faster than probability methods.
Weighting and Modeling Improvements: Modern statistical techniques allow pollsters to adjust quota samples to better represent the target population by weighting responses based on known population parameters.
Hybrid Approaches: Many pollsters now use hybrid methods that combine elements of probability and non-probability sampling, with sophisticated weighting and modeling to improve accuracy.
The 2016 US presidential election, where many polls failed to predict the outcome accurately, led to considerable soul-searching among pollsters. Rather than abandoning quota sampling, many organizations have refined their methods, focusing on better quota definitions, improved weighting techniques, and more transparent reporting of methodological limitations.
Despite these trends, it’s important to note that probability sampling remains the gold standard for statistical inference. Well-designed probability samples still provide the most reliable foundation for generalizing from sample to population, especially for academic research where accuracy is prioritized over cost and speed.
5.2 Statistical Errors
Systematic Error vs. Random Error
Systematic errors and random errors represent fundamentally different ways measurements can deviate from true values:
- Systematic Error (Bias)
- Definition: Consistent, predictable deviations from the true value in a specific direction.
- Characteristics:
- Results in measurements that are consistently too high or too low
- Does not diminish with increased sample size
- Can often be corrected if identified
- Examples:
- A scale that consistently reads 2 pounds heavier than actual weight
- Selection bias from excluding certain population groups
- Leading questions in a survey that push respondents toward particular answers
- Detection and Correction:
- Calibration against known standards
- Comparison with measurements using different methods
- Careful research design and pretesting
- Random Error
- Definition: Unpredictable fluctuations in measurements due to chance factors.
- Characteristics:
- Varies in both magnitude and direction across measurements
- Follows a probability distribution (often normal)
- Decreases as sample size increases (√n relationship)
- Examples:
- Natural biological variations between subjects
- Minor fluctuations in measuring instruments
- Environmental conditions that vary randomly during measurement
- Detection and Reduction:
- Increasing sample size
- Taking repeated measurements
- Improving measurement precision
Sampling Errors vs. Non-Sampling Errors
This distinction focuses on the source of errors in statistical studies:
- Sampling Error
- Definition: Difference between a sample statistic and the true population parameter due to random variation in selection.
- Characteristics:
- Unavoidable in any sample-based study
- Quantifiable through statistical measures (standard error, confidence intervals)
- Decreases predictably as sample size increases
- Always random in nature (not systematic)
- Examples:
- A random sample showing 52% support for a policy when the true population value is 50%
- Variation in mean income across different random samples from the same population
- Control Methods:
- Increasing sample size
- Using more efficient sampling designs (e.g., stratification)
- Statistical adjustments like weighting
- Non-Sampling Error
- Definition: All errors not attributable to sampling fluctuation, occurring in both sample surveys and complete censuses.
- Characteristics:
- Can be systematic or random
- Often harder to detect and quantify than sampling error
- Doesn’t necessarily decrease with larger samples
- Potentially more damaging to research validity than sampling error
- Types and Examples:
- Coverage Error (systematic): Using a voter registration list that omits recent registrants
- Nonresponse Error (can be systematic or random): Higher refusal rates among certain demographics
- Measurement Error (can be systematic or random):
- Systematic: Poorly worded questions that consistently bias responses
- Random: Occasional data entry mistakes
- Processing Error (can be systematic or random):
- Systematic: Consistently miscoding certain responses
- Random: Occasional transcription errors
The Total Survey Error Framework
Modern survey methodology approaches error through the Total Survey Error (TSE) framework, which considers all sources of error that can affect survey quality:
- Representation Errors (affecting who is included):
- Coverage error
- Sampling error
- Nonresponse error
- Adjustment error (from weighting/imputation)
- Measurement Errors (affecting the accuracy of responses):
- Specification error (measuring the wrong concept)
- Measurement error (respondent, interviewer, questionnaire effects)
- Processing error (data entry, coding, editing)
Understanding the interplay between these error types is crucial for designing high-quality research and appropriately interpreting results. While sampling error receives considerable attention because it’s easier to quantify, non-sampling errors often pose greater threats to validity in modern research.
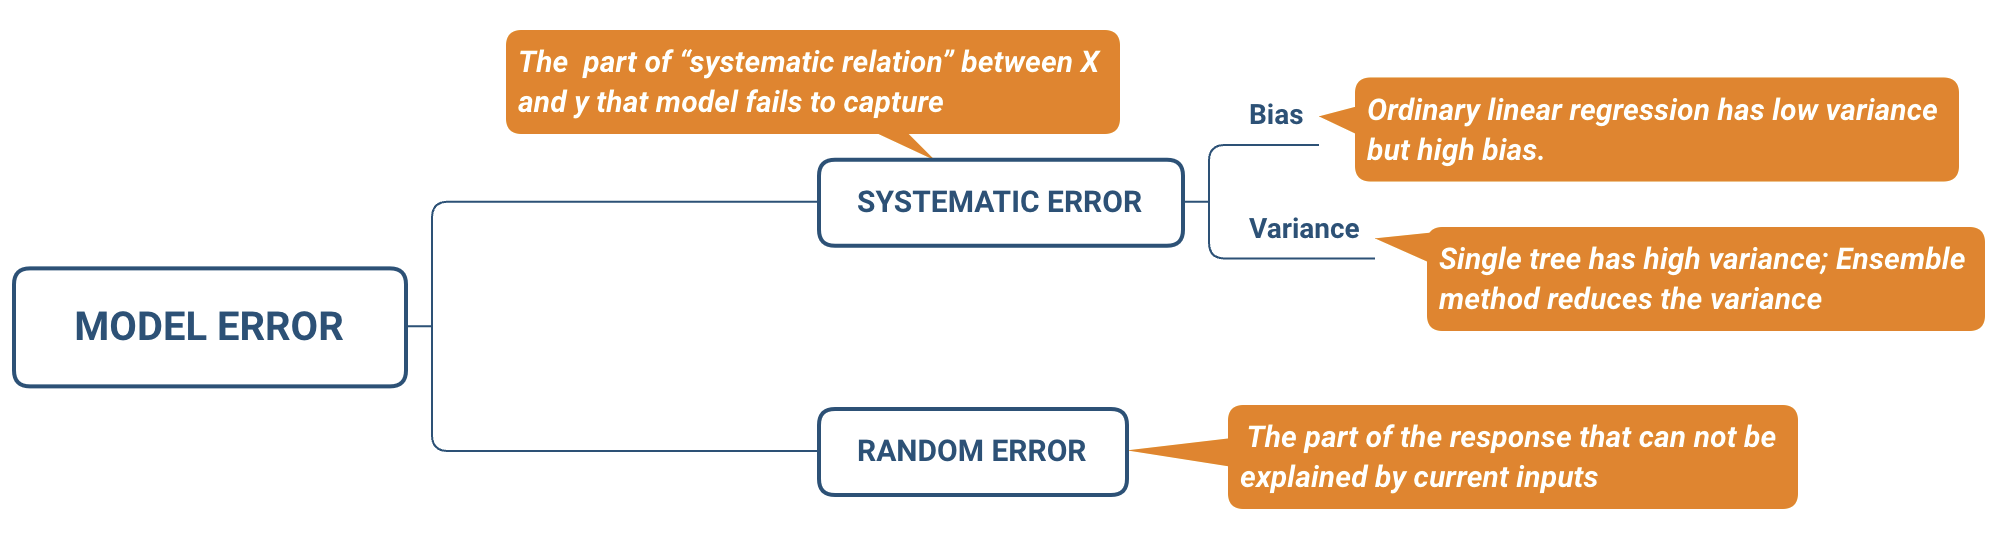
Figure: The relationship between model complexity, bias, and variance. This illustrates how the balance between systematic error (bias) and random error (variance) affects overall model error.